Long-term river water quality indicator
Monitoring
In 2011, the Scottish Environment Protection Agency (SEPA) established an indicator of river water quality based on a network of sites covering 253 water bodies (rivers or sections of rivers), which account for approximately 10% of all water bodies. The indicator is based on a consistent set of five water quality parameters which are sensitive to organic pollution, nutrients and toxic substances and provide a measure of species diversity. Each of the parameters was assessed over a rolling 3 year period and the results weighted by river length. The assessment is against the standards provided for each parameter in the Water Framework Directive classification. Two of the Water Framework Directive standards, invertebrates and phosphorus, used to calculate the indicator were changed in 2013; however, SEPA is looking into back calculating the indicator values potentially as far back as 2007 using the new standards to provide a consistent time series.
In this indicator, river water quality is classified as unpolluted, unimpacted by pollution, slightly polluted, polluted, or severely polluted.
Trends
Prior to the rapid urbanisation of the 1800's, Scotland's rivers were of very good quality. The deterioration of river water quality throughout the 19th and 20th centuries was mainly caused by the discharge of sewage and changes in agricultural and industrial practices which accompanied the economic lifestyle of the time. Significant efforts to restore Scotland's rivers did not occur until 1965. Reductions in heavy industry, the enforcement of new legislation and heightened environmental awareness have all contributed to improvements in river quality.
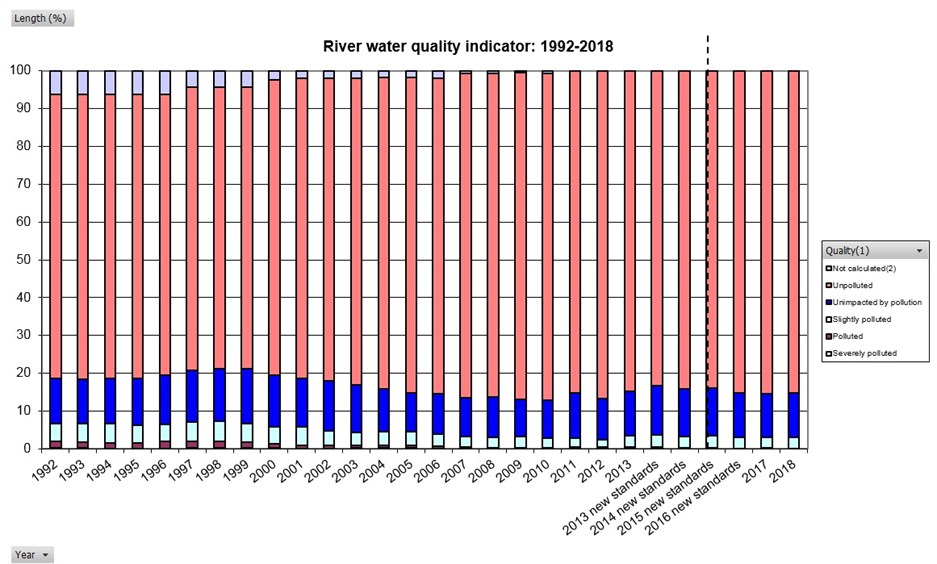
Between 1992 and 2011, the proportion of river length for which river quality could not be calculated fell from 6.2% to 0%. Most of these water bodies were subsequently classed as unpolluted or unimpacted by pollution.
The proportion of river length that was classed as slightly polluted, polluted or severely polluted in Scotland rose from 6.8% in 1992, to 7.4% in 1998, before falling to 2.3% in 2012 and then rising to 3.4% in 2013. The main drivers of slightly polluted, polluted and severely polluted rivers are inputs of nutrients, leading to degraded biological and nutrient quality.
In light of increasing data and understanding about environmental pressures and ecological impact, two of the Water Framework Directive standards used in the indicator calculation were changed in 2013. These were invertebrates and phosphorus. In 2013, the indicator was calculated with both the old and the new standards in order that a comparison could be made. The proportion of river length assessed as slightly polluted, polluted or severely polluted in 2013 was 3.4% using the old standards and 3.7% using the new standards.
From 2014 data was calculated with just the new standards.
In 2018, the proportion of river length classed as slightly polluted, polluted or severely polluted was 3%.
More information on the state of Scotland’s rivers is available on Scotland’s environment website .